Ship Stability – Curves of Statical Stability
Load Line requirements for minimum stability conditions
The area under the GZ curve shall not be less than
0.55 m-rad up to an angle of 30°
0.09 m-rad up to an angle of either 40° or the lesser angle at which the lower edges of any openings which can not be closed weather-tight are immersed
0.03 m-rad between the angles of heel of 30° and 40° or such lesser angle as mentioned above
The Righting Lever (GZ) shall be at least 0.20m at an angle of heel equal to or greater than 30°
The maximum GZ shall occur at an angle of heel of not less than 30°
Initial transverse metacentric height shall not be less than 0.15m. For ship carrying timber deck cargo complying with (a), this may be reduced to not less than 0.05 metres.
Curve Of Statical Stability
Graph where GZ is plotted against the angle of heel.
Drawn for each voyage condition by the ship’s officer.
This curve is for a particular displacement and KG.
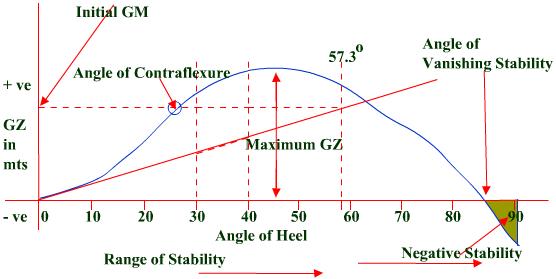
From this curve it is possible to ascertain the following:
Initial metacentric height – point of intersection of the tangent drawn to the curve at the initial point and a vertical through the angle of heel of 57.3° (1 radian).
Angle of contraflexure – the angle of heel up to which the rate of increase of GZ with heel is increasing. Though the GZ may increase further, the rate of increase of GZ begins to decrease at this angle.
The range of stability – where all GZ values are positive.
The maximum GZ lever & the angle at which it occurs.
The angle of vanishing stability – beyond which the vessel will capsize.
The area of negative stability.
The moment of statical stability at any given angle of heel (GZ x Displacement of the ship).
The moment of dynamical stability – work done in heeling the ship to a particular angle.
Dynamical stability at è = W x A (in t-m-rad)
W = Displacement (in tonnes)
A = area between the curve and the baseline up to the given angle of heel (in metre-radians).
GZ Cross Curves of Stability
To draw the curve of statical stability, we need GZ values for various angles of heel.
For this we use the GZ cross curves of stability.
These curves are provided for an assumed KG, tabulating GZ values for various displacements and angles of list.
Called cross curves because the various curves actually ‘cross’ each other.
Since the curves are plotted for an assumed KG, if the actual KG differs from this a correction (GG1Sineθ) needs to be applied.
This correction is positive if the actual KG is less than the assumed KG and vice-versa.
After obtaining the GZ values at various angles, the curve of statical stability is prepared.
KN Cross Curves of Stability
Same as the GZ cross curves and also used to get the GZ values for making the curve of statical stability.
The only difference being that here the KG is assumed to be ZERO.
This solves the problem of a sometimes positive and sometimes negative correction, as now the correction is always subtracted.
GZ = KN – KG Sine θ
Written by Capt. Jayant Roy


