
HYDROSTATIC CURVES
For a given loading condition the draughts at which a ship will float are determined by:
• the geometry of the ship;
• the distribution of weights within the ship; and
• the density of the water in which the ship is floating. Standard mass densities used are 1.025 tonne/m3 for salt water and 1.000 tonne/m3 for fresh water.
Whilst the distribution of weights is constantly varying during a ship’s service, the geometry is fixed by the design. A very useful set of curves can be produced based on the hull form. A series of waterplanes parallel to the design waterline are taken, covering the full depth of the hull. The area of each waterplane and its centre of flotation (CF) can be found.
Consider a small weight placed on the ship vertically above the CF. The ship will sink bodily by a small amount, say δT. The extra volume of water displaced is A δT where A is the area of the waterplane. The centre of buoyancy of this extra water will be above the CF provided the waterplane shape stays the same as the ship sinks slightly. Thus, the buoyancy force of the extra water will directly oppose the added weight with no moment to cause the ship to trim.
By definition, as the CF is the centroid of area of the waterplane, the area of waterplane forward of the CF equals that aft of the CF. If the ship trims through a small angle about a transverse axis through the CF, the volumes of emerged and immersed wedges will be equal and the overall displacement remains unchanged.
From the form of the ship, the volume of displacement up to any waterplane, and the corresponding vertical position of the centre of buoyancy (VCB) can be calculated by using the waterplane areas and Simpson’s rules to obtain the volume and taking moments about the keel up to that draught.
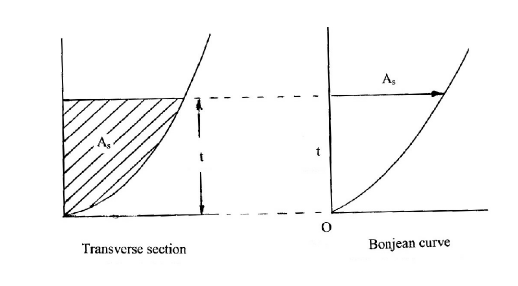
In a similar way, the immersed area of each transverse section up to each waterplane can be found. By integrating along the length and taking moments the volume of displacement and position of the longitudinal centre of buoyancy (LCB) can be found. A curve of the area of any cross-section to various draughts plotted against draught is useful in a number of calculations. It is known as a Bonjean curve.
Tonnes Per Centimetre Immersion (TPC) For each waterplane the area defines, for a given density of water, the change in buoyancy in tonnes is experienced due to unit increase or decrease in draught. The unit of draught change considered is one centimetre, giving the tonnes per cm immersion (TPC). The other form that is sometimes used is TPI, standing for tonnes per unit immersion. If the area of a waterplane is A m2 and the water density is ρ tonnes per m3, then the TPC will be Aρ/100.
Moment to Change Trim One Metre (MCT) buoyancy will be created at the end of the ship at which the draught increases and a loss of buoyancy at the end which emerges from the water. The forces due to these buoyancy forces will produce a moment which will act so as to oppose the change of trim. The total buoyancy will remain constant and equal to the ship’s weight, W, otherwise the ship would move up or down. If ML is the longitudinal metacentre, the righting movement will be:
W.GML.ϕ
This will be the moment required to hold the ship at the new trim angle. If the trim change is one metre between perpendiculars, the moment is referred to as the moment to change trim one metre (MCT).
It will be noted that the MCT does depend upon the position of G, so it will vary with the loading of the ship. However, BML (=IL/V) is large, typically of the order of the length of the ship. It will be appreciated that the variation in the height of G above the keel will be small compared with GML. Hence, GML will not vary much with the loading of the ship. The student will now appreciate why, in the previous chapter, the transverse and longitudinal inertias of the waterplane were mentioned. They are important in defining the heights of the transverse and longitudinal metacentres above the centre of buoyancy.
We have seen that for small changes in trim about the CF, there is no change in overall displacement. If the trim, ϕ, is about amidships, there will be a change of draught at the CF given by:
xϕ where x is the distance of the CF from amidships
There will be a corresponding change in displacement given by:
xϕ (TPC)
This change will be an increase when the trim is such that the draught at the CF position increases.
A plot of the above data against draught gives rise to a set of curves known as the hydrostatic curves or hydrostatics.


