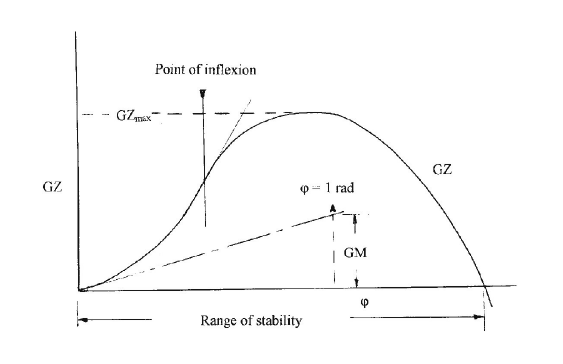
THE GZ CURVE OR CURVE OF STATICAL STABILITY A typical plot of GZ against angle of heel is shown here.

Some interesting information can be deduced from the statical stability curve:
• The slope of the curve at the origin represents the value of GM for small angles.
• The maximum value of GZ multiplied by the displacement represents the greatest steady heeling moment the ship can sustain without turning right over.
• The angle at which GZ becomes zero is known as the point of vanishing stability and defines the range of stability.
• The point of inflexion on the way to the maximum is an indication of the angle at which a reasonable length of deck edge has become immersed.
• The area under the curve up to any given angle, multiplied by the displacement, represents the energy needed to heel the ship to that angle. It is referred to as the ship’s dynamical stability and is a measure of the ability of the ship to absorb the energy imparted by waves and gusting winds. This should not be confused with a ship’s dynamic stability which is a measure of its ability to maintain a constant heeling.


